 FlowForgeDemo build · fictional business, simulated data
Watch the workflow run. Watch the spreadsheet fill itself.
Marketing automation on a node canvas — triggers, enrichment, email, SMS, and Canva wired together, with runs you can watch execute step by step.
Live demos are password-gated — request access via WhatsApp, takes a minute.
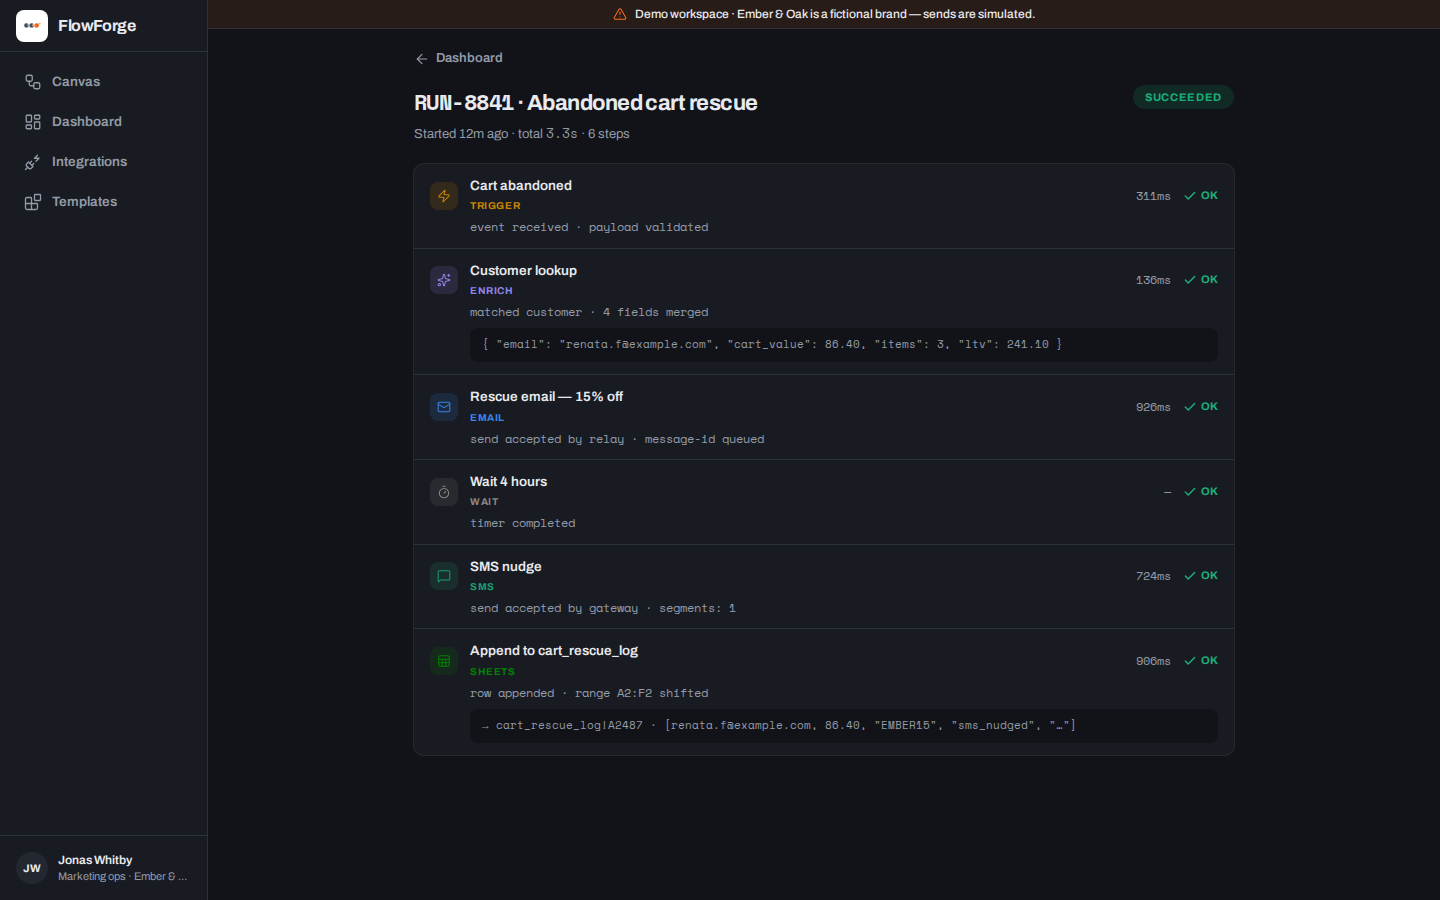
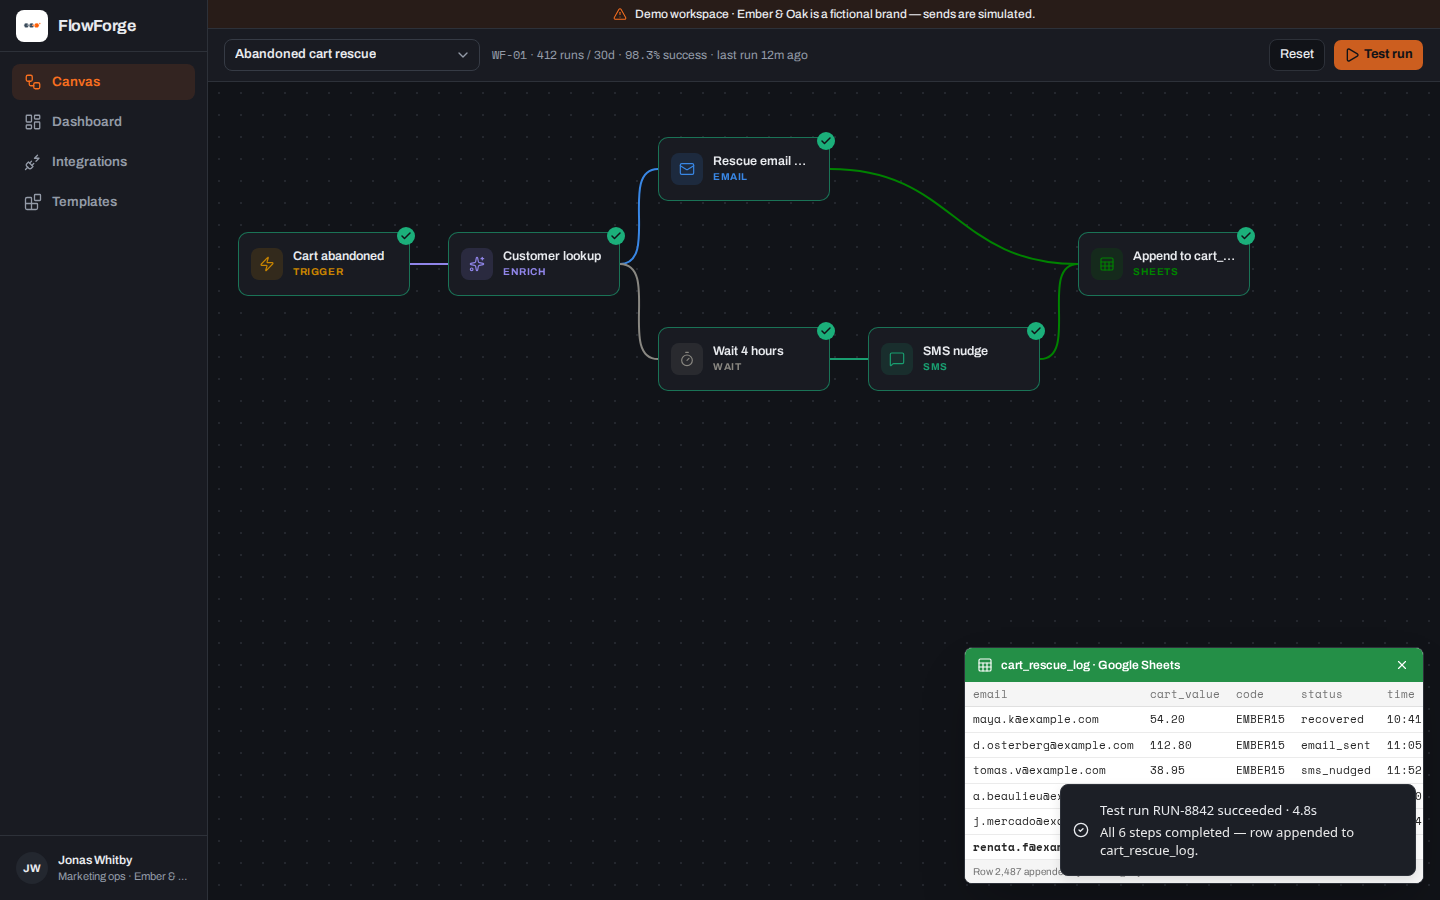 Six typed nodes, each ignited in sequenceThe Sheet appends row 2,487 on screen
The challenge
Automation tools sell a feeling: the moment work happens without you. A static screenshot of a node graph doesn’t deliver it — the run has to be watchable.
Buyers coming from n8n/Zapier searches judge fast: the canvas has to read as a real editor, and the run history as production telemetry, in the first five seconds.
The solution — three decisions
The canvas is the first impression
Typed nodes (trigger, enrich, email, SMS, Sheets, Canva) with curved wires on a dot grid — laid out by hand for the signature flow, auto-laid for the rest.
Execution you can see
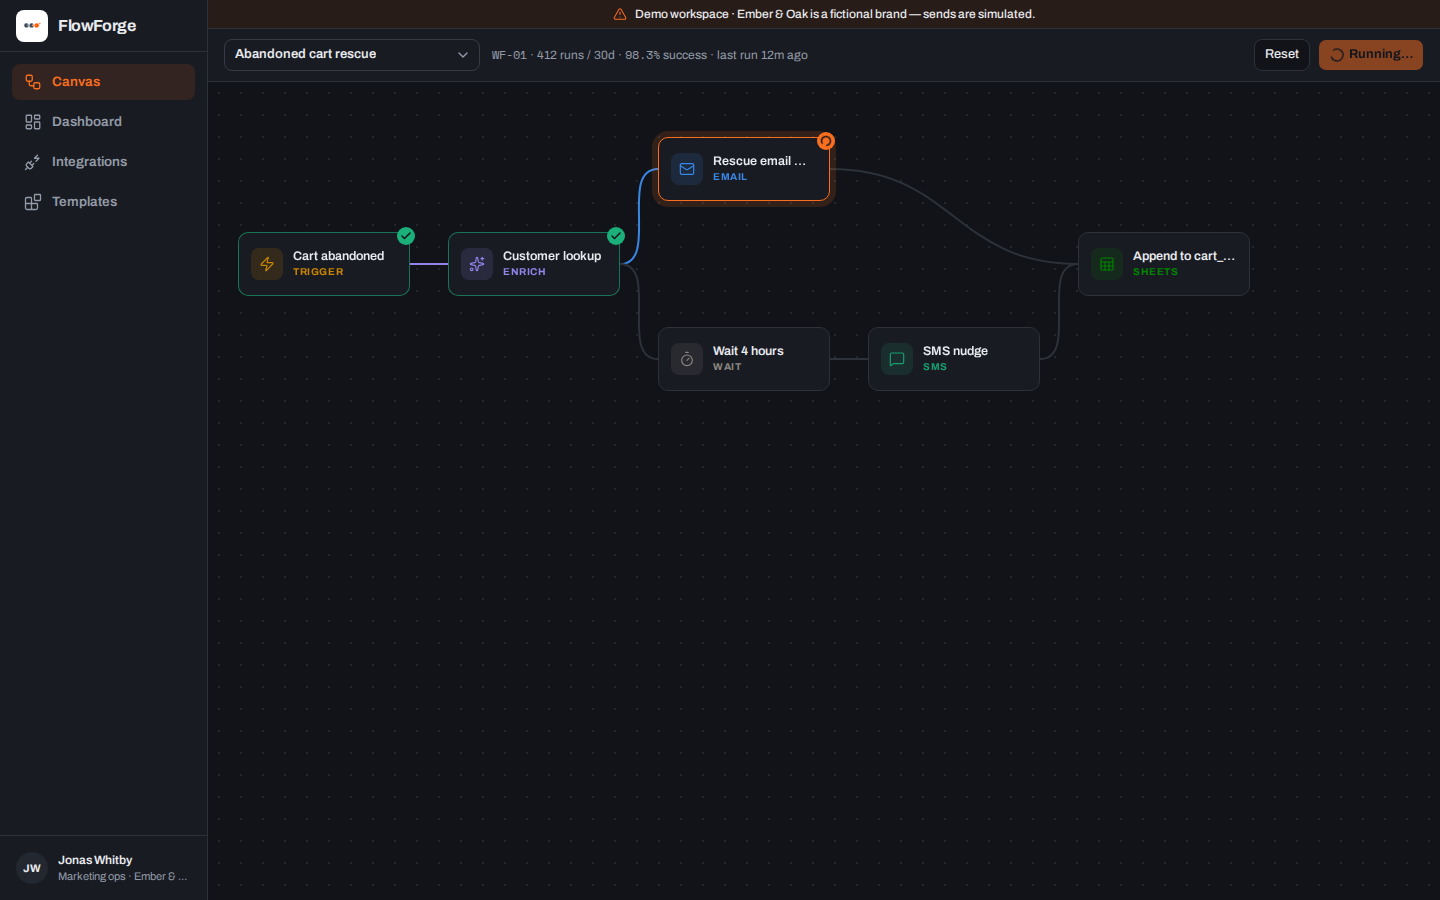
Test run ignites nodes in sequence — heat ring, then green check — while the wire carrying the run brightens. The Sheet panel opens itself and appends the row with a flash.
Honest telemetry
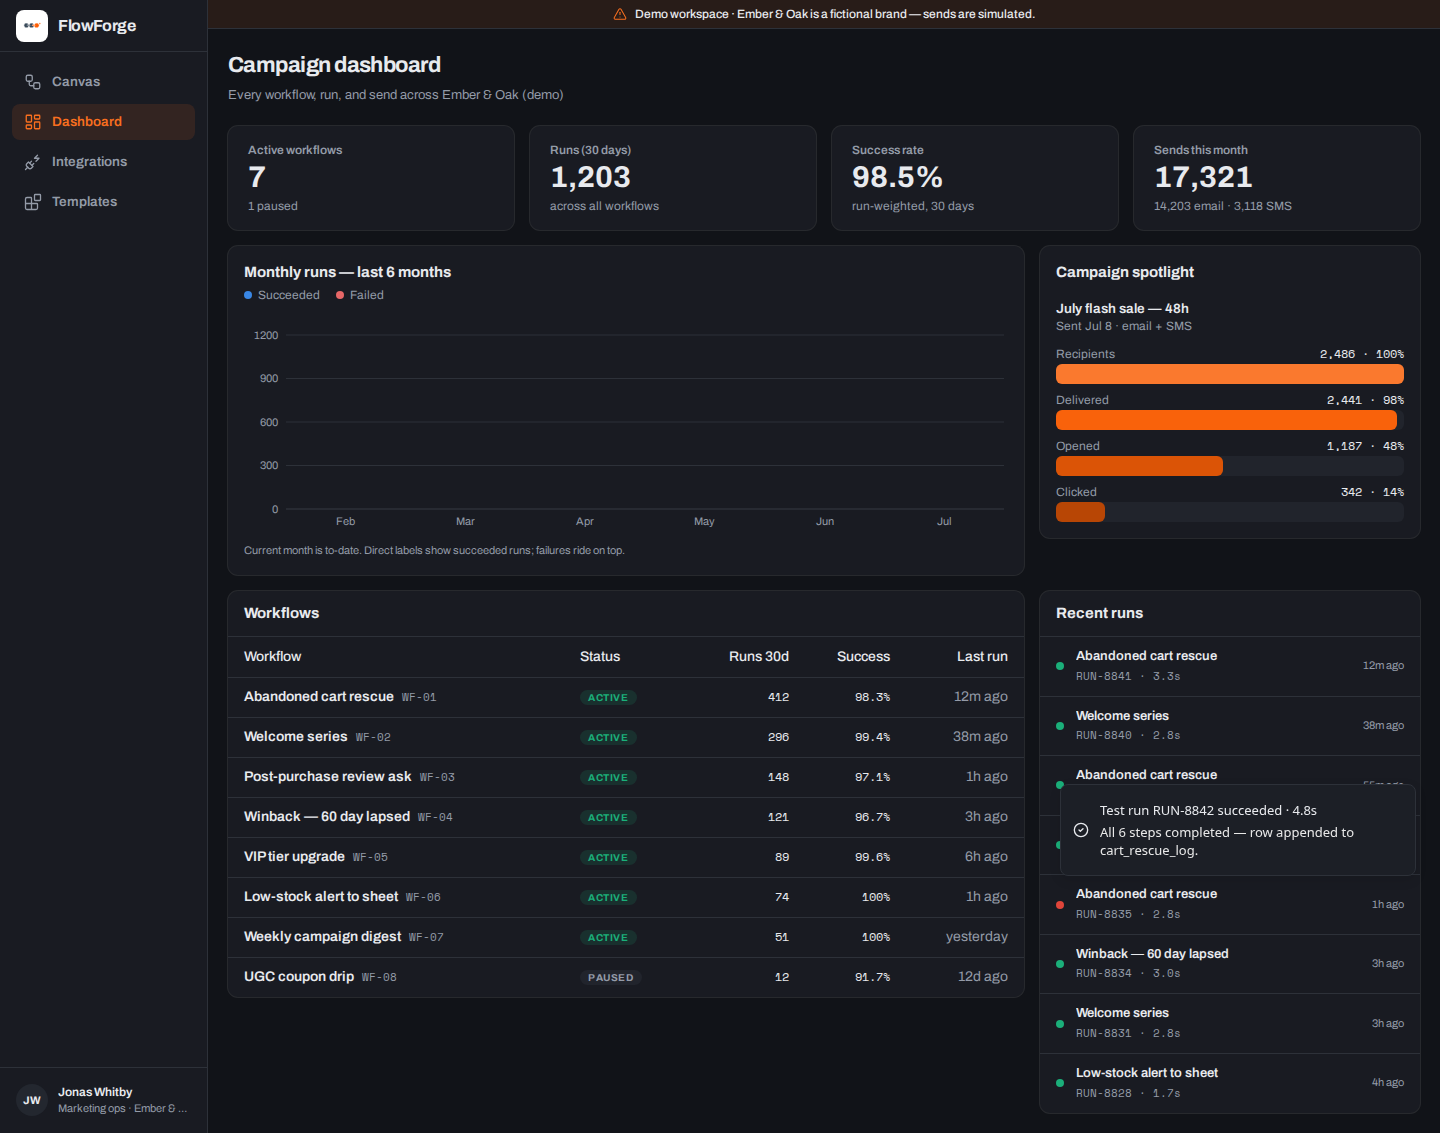
Six months of lumpy trend data, a run-weighted success rate, and a failed run in the log with a retry note — real systems have bad days, and showing one builds trust.
How it works
Flow diagram: the inputs listed first feed into the FlowForge orchestrator engine in the middle, which produces the outputs listed last.
In
FlowForge orchestrator
Out
The demo implements this shape end to end with a simulated service layer — the “extend for production” section below lists what swaps in for live deployment.
Product tour
What the demo shows
- A repeatable on-camera run: reset, ignite, sheet update, success toast
- Eight workflows whose run counts sum exactly to the dashboard total
- Integrations with one honest “attention” state (an expiring Canva token)
- A template gallery wired to real actions, not dead buttons
Under the hood
- Canvas is hand-rolled SVG: typed nodes, bezier edges, run-order animation — no graph library
- The run engine and the Sheet panel share state, so the row append lands mid-run, not after
- Node identity is never color-alone: icon + label + validated dark-palette color per type
- The portfolio’s only dark app — forge orange strictly reserved for “executing right now”
Built as a demonstration — on purpose.
Ember & Oak is fictional and labeled as a demo on every screen. Nothing here is presented as client work: no client names, no outcome metrics, no testimonials. The proof is the running product — open the live demo above (password on request) and check every claim.
What I’d extend for production
- A real executor (queue + retries) behind the same run model
- Drag-to-wire canvas editing with schema-checked node configs
- Live Google Sheets/ESP/SMS connectors replacing the simulators